Background:
As a UX engineer, I often found the process of logging accessibility issues to be time-consuming and inefficient. I’ve long wanted to create a tool that would streamline this workflow and simplify issue reporting and automatically generate clear, useful reports.
Problem
Accessibility issues are typically logged manually, often using spreadsheets. While tools exist to assist, many are unintuitive or cumbersome, especially when dealing with large volumes of issues.
Additionally, accessibility reports can be overwhelming for non-technical stakeholders. They often require extra explanation to be actionable, which creates communication friction and slows down remediation.
This Reddit discussion on logging accessibility issues highlights many of these shared frustrations within the accessibility community.
" I’m just looking to see what was the best way to present them [a11y issues]. I have been using Excel so far but I’m searching for something a little bit more polished. "
alekeuwu - Reddit User
Agentic System Design:
The system began as a manual, multi-chat workflow I used to enrich issues and draft reports. It has since been consolidated into a cohesive app experience that orchestrates AI calls server-side.
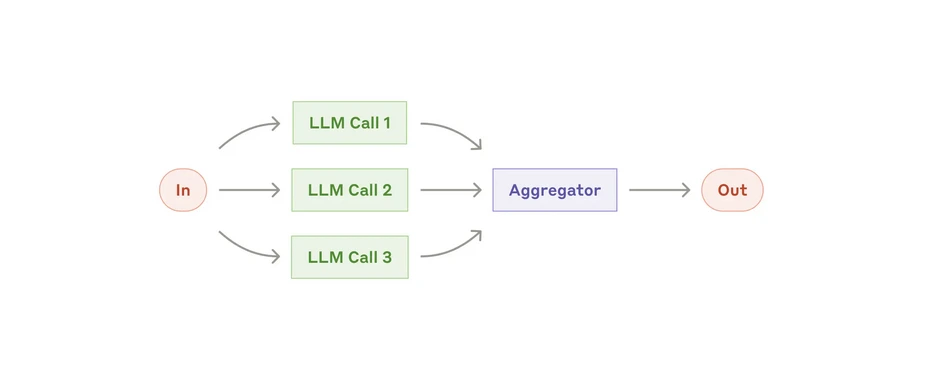
The agent design is inspired by Anthropic's Parallelization workflow, adapted for two primary modes: a single master prompt that generates the executive summary and all personas, and a persona micro-prompt mode that runs six summaries in parallel and merges results.
My system is built around four AI agents, each with a specific role:
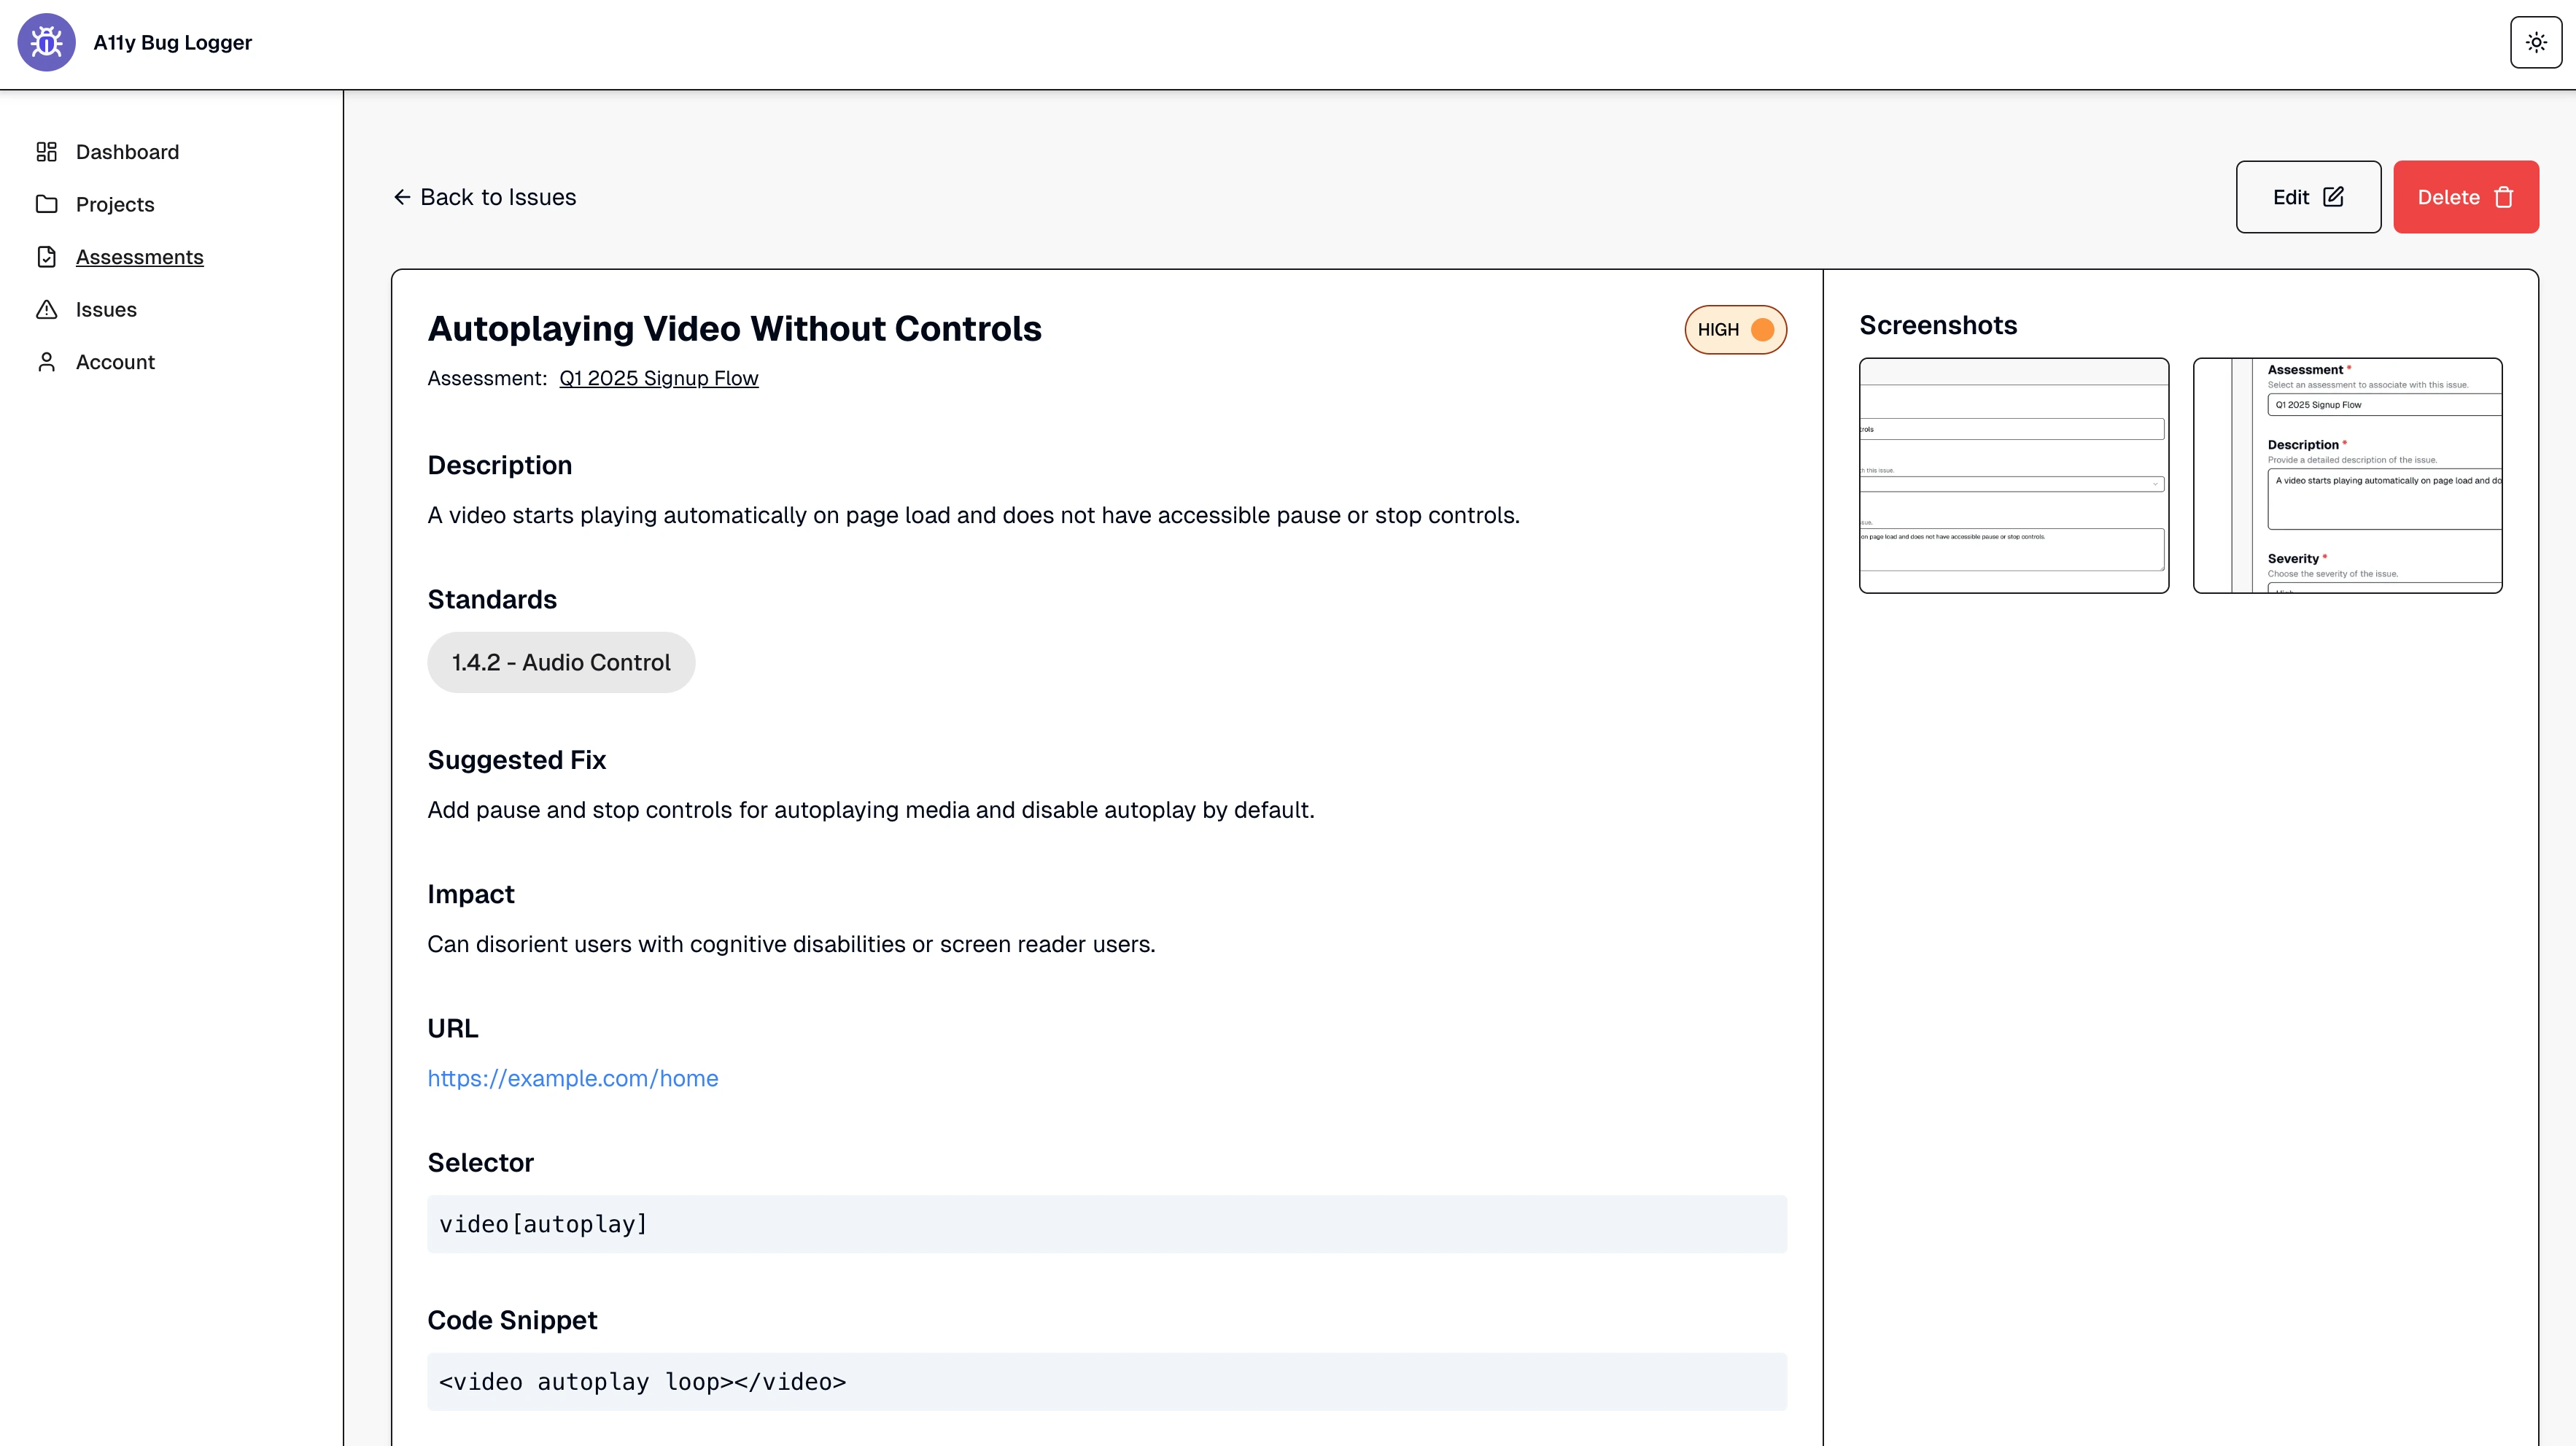
- Issue Enrichment – Expands titles/descriptions, suggests code-level fixes, and maps issues to WCAG criteria.
- Report Generation (Master) – Produces an executive summary and six persona summaries in one pass with strict JSON output.
- Report Generation (Personas) – Runs six persona micro-prompts in parallel, validates each, and merges into a final report with a separate executive summary.
- Pattern Explainer (Optional) – Extracts recurring patterns (e.g., low contrast, missing labels) to improve clarity and impact estimation.
Model Design:
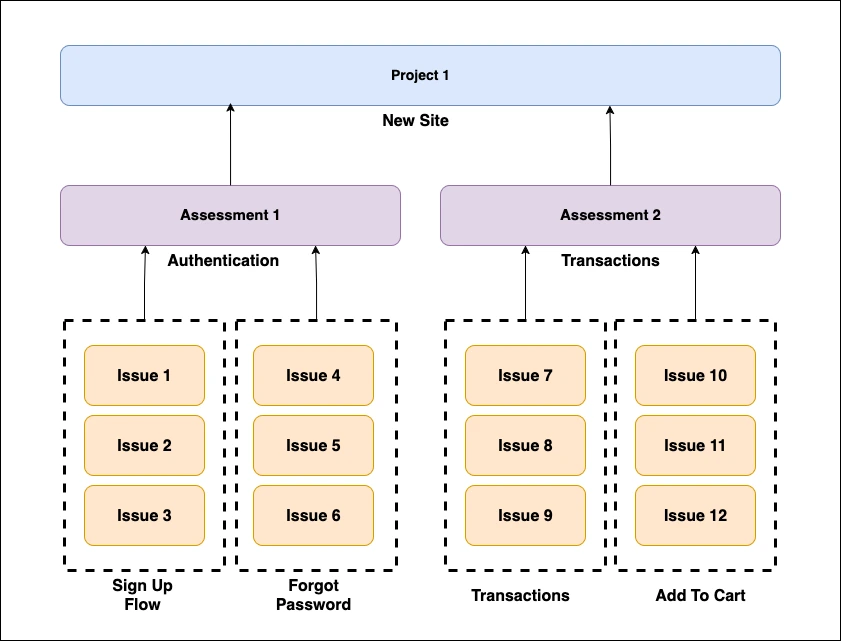
The application's data model enables users to categorize and manage accessibility issues across multiple levels of context.
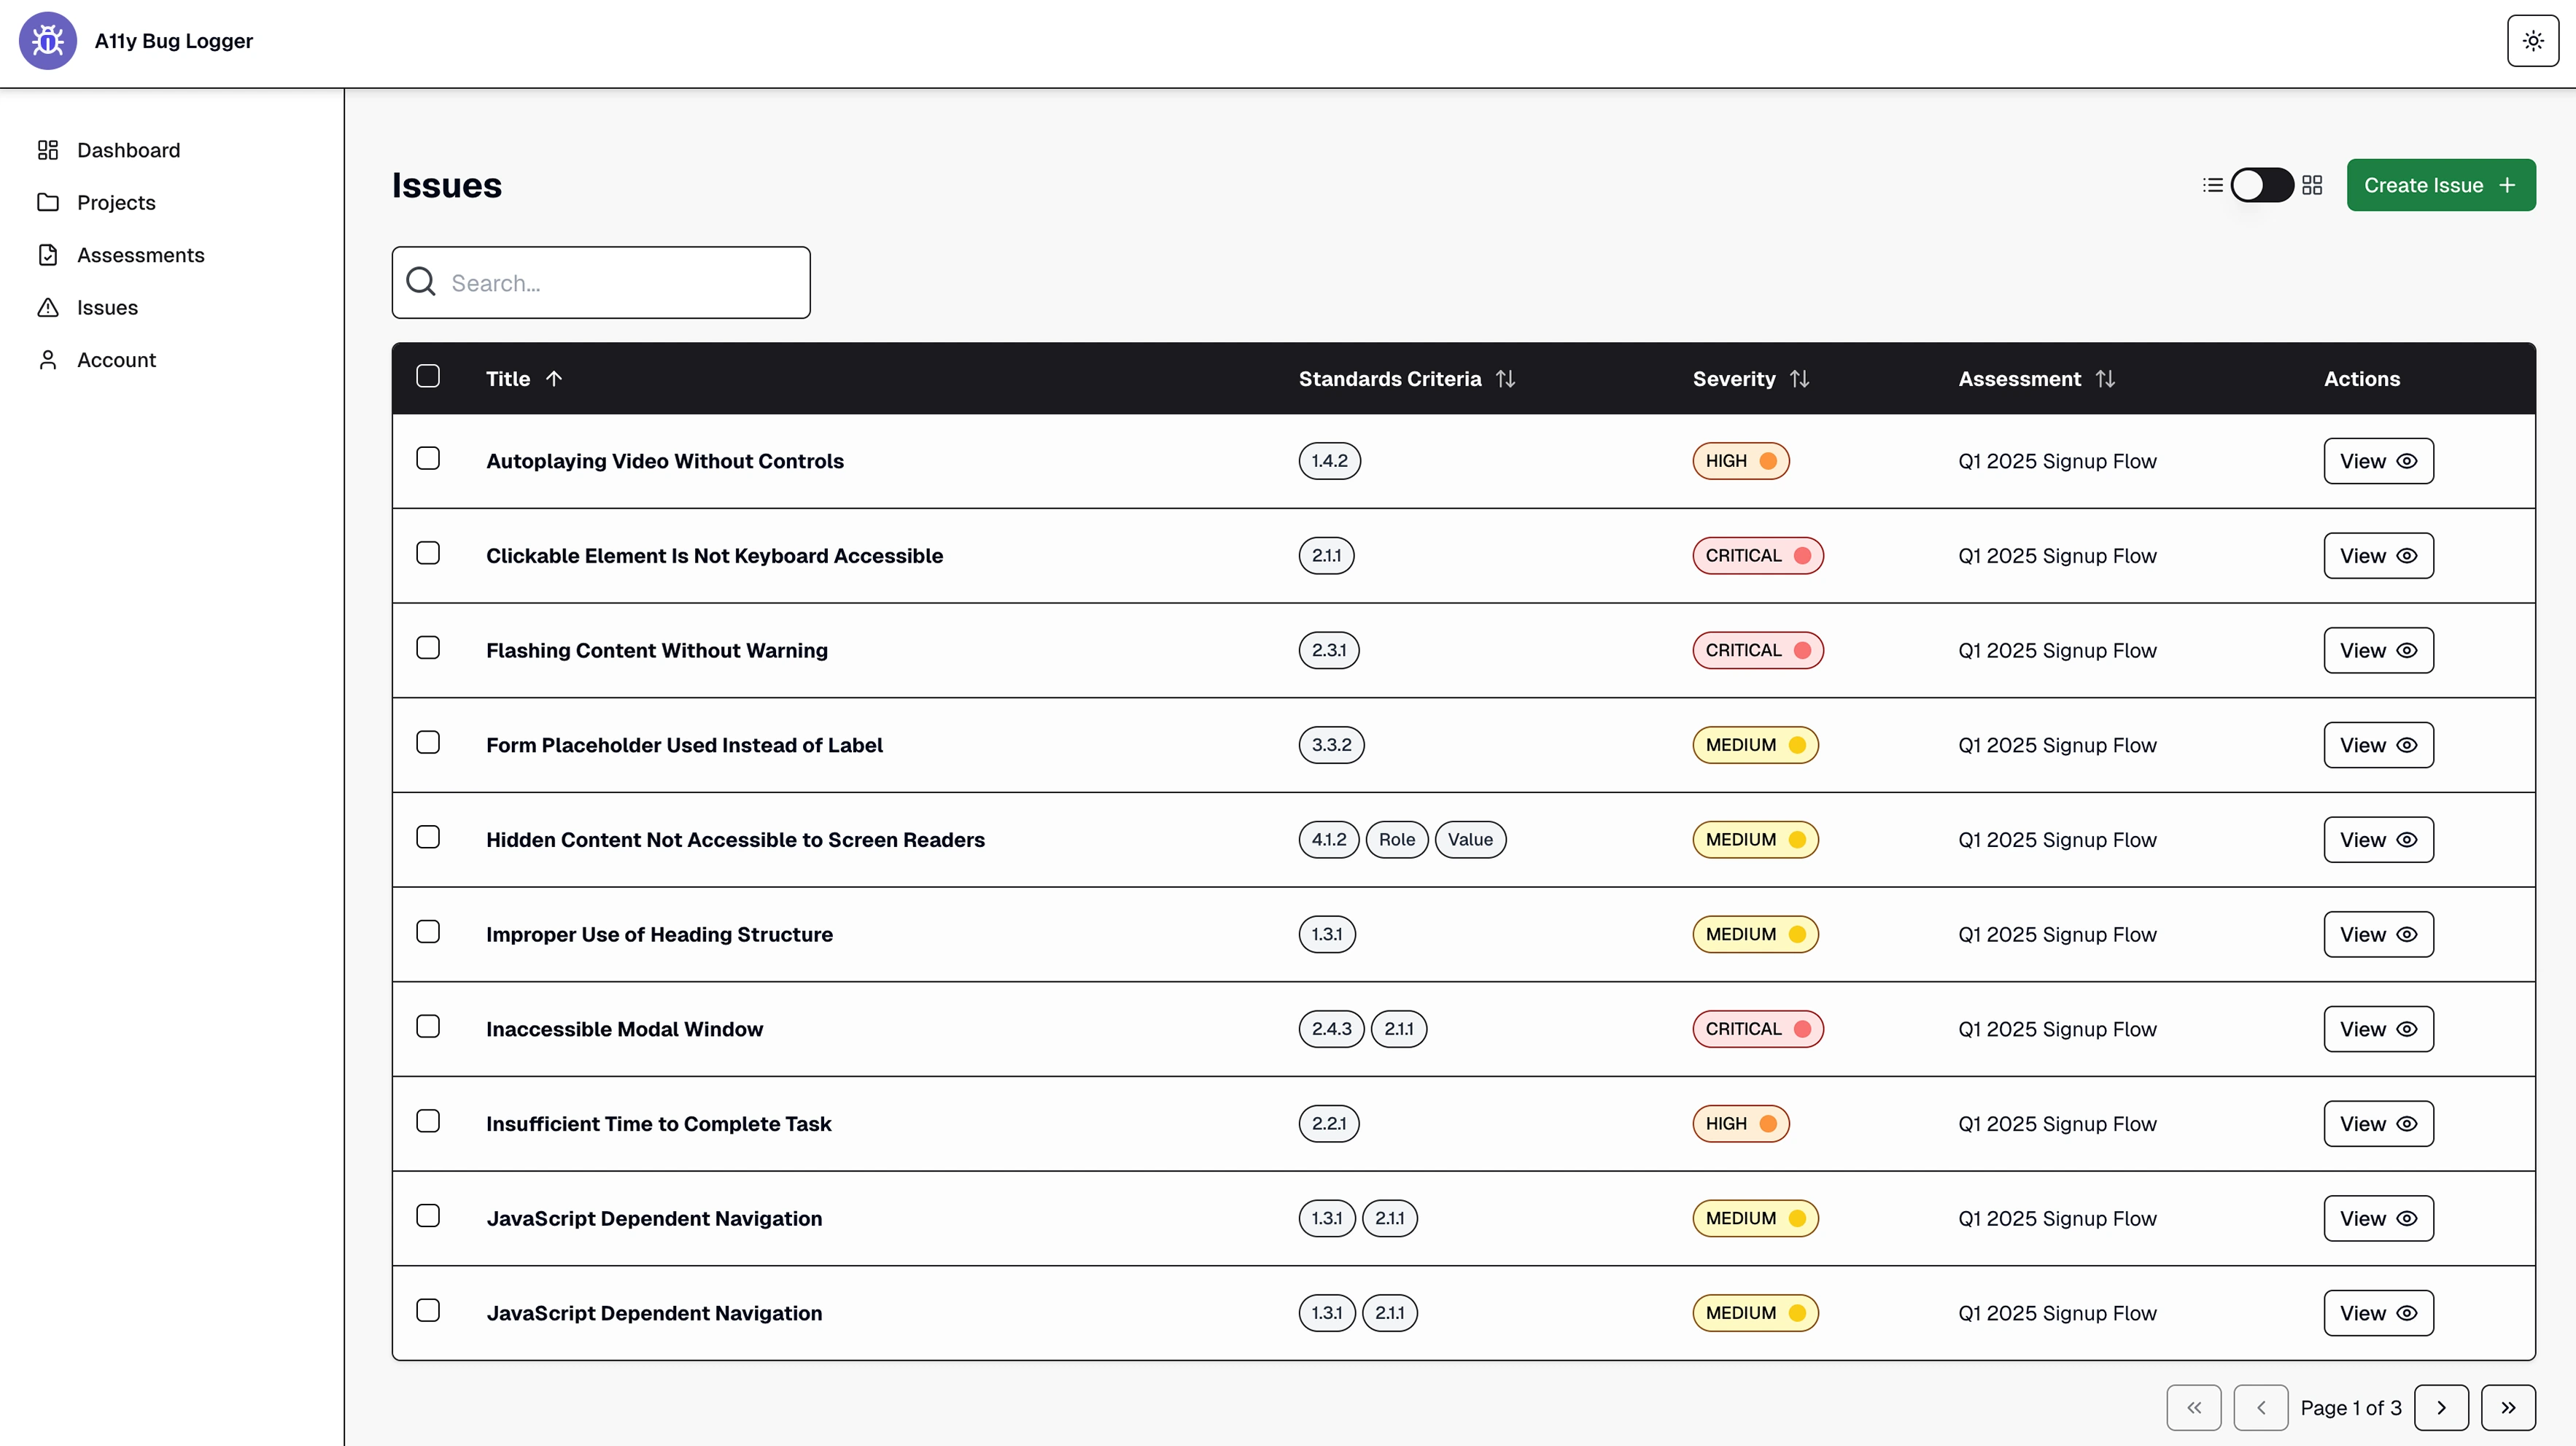
- Issues – The foundational element of the system. Users log individual accessibility problems, which serve as the core data for reports and analysis.
- Assessments – Assessments group related issues together. For instance, a large website might have separate assessments for different flows like signup or checkout. Reports can be generated at this level.
- Projects – Projects serve as containers for multiple assessments. This makes it easier to track accessibility efforts across an entire product or client.
UI Design:
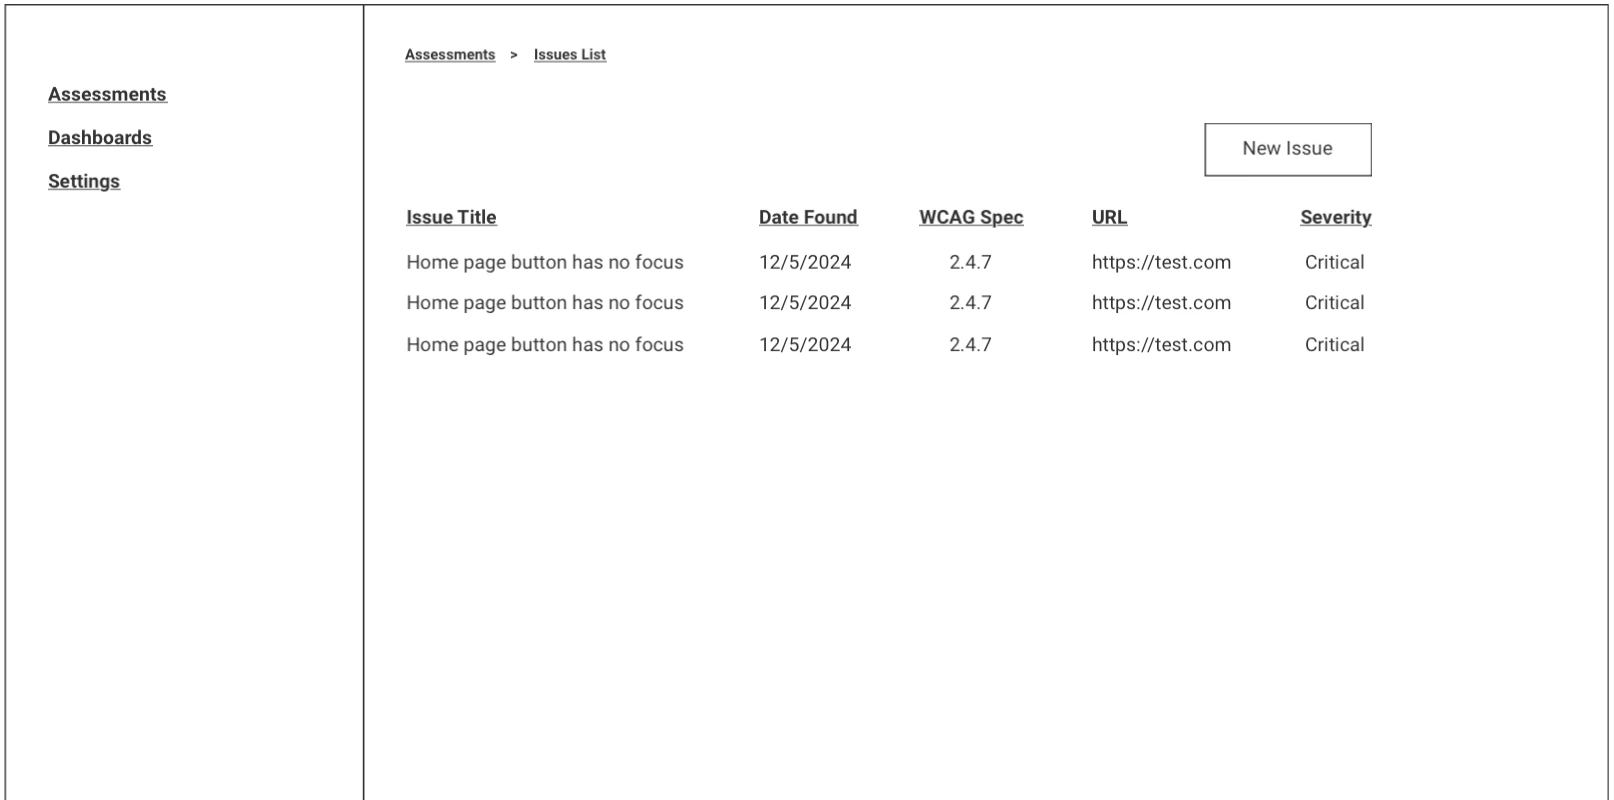
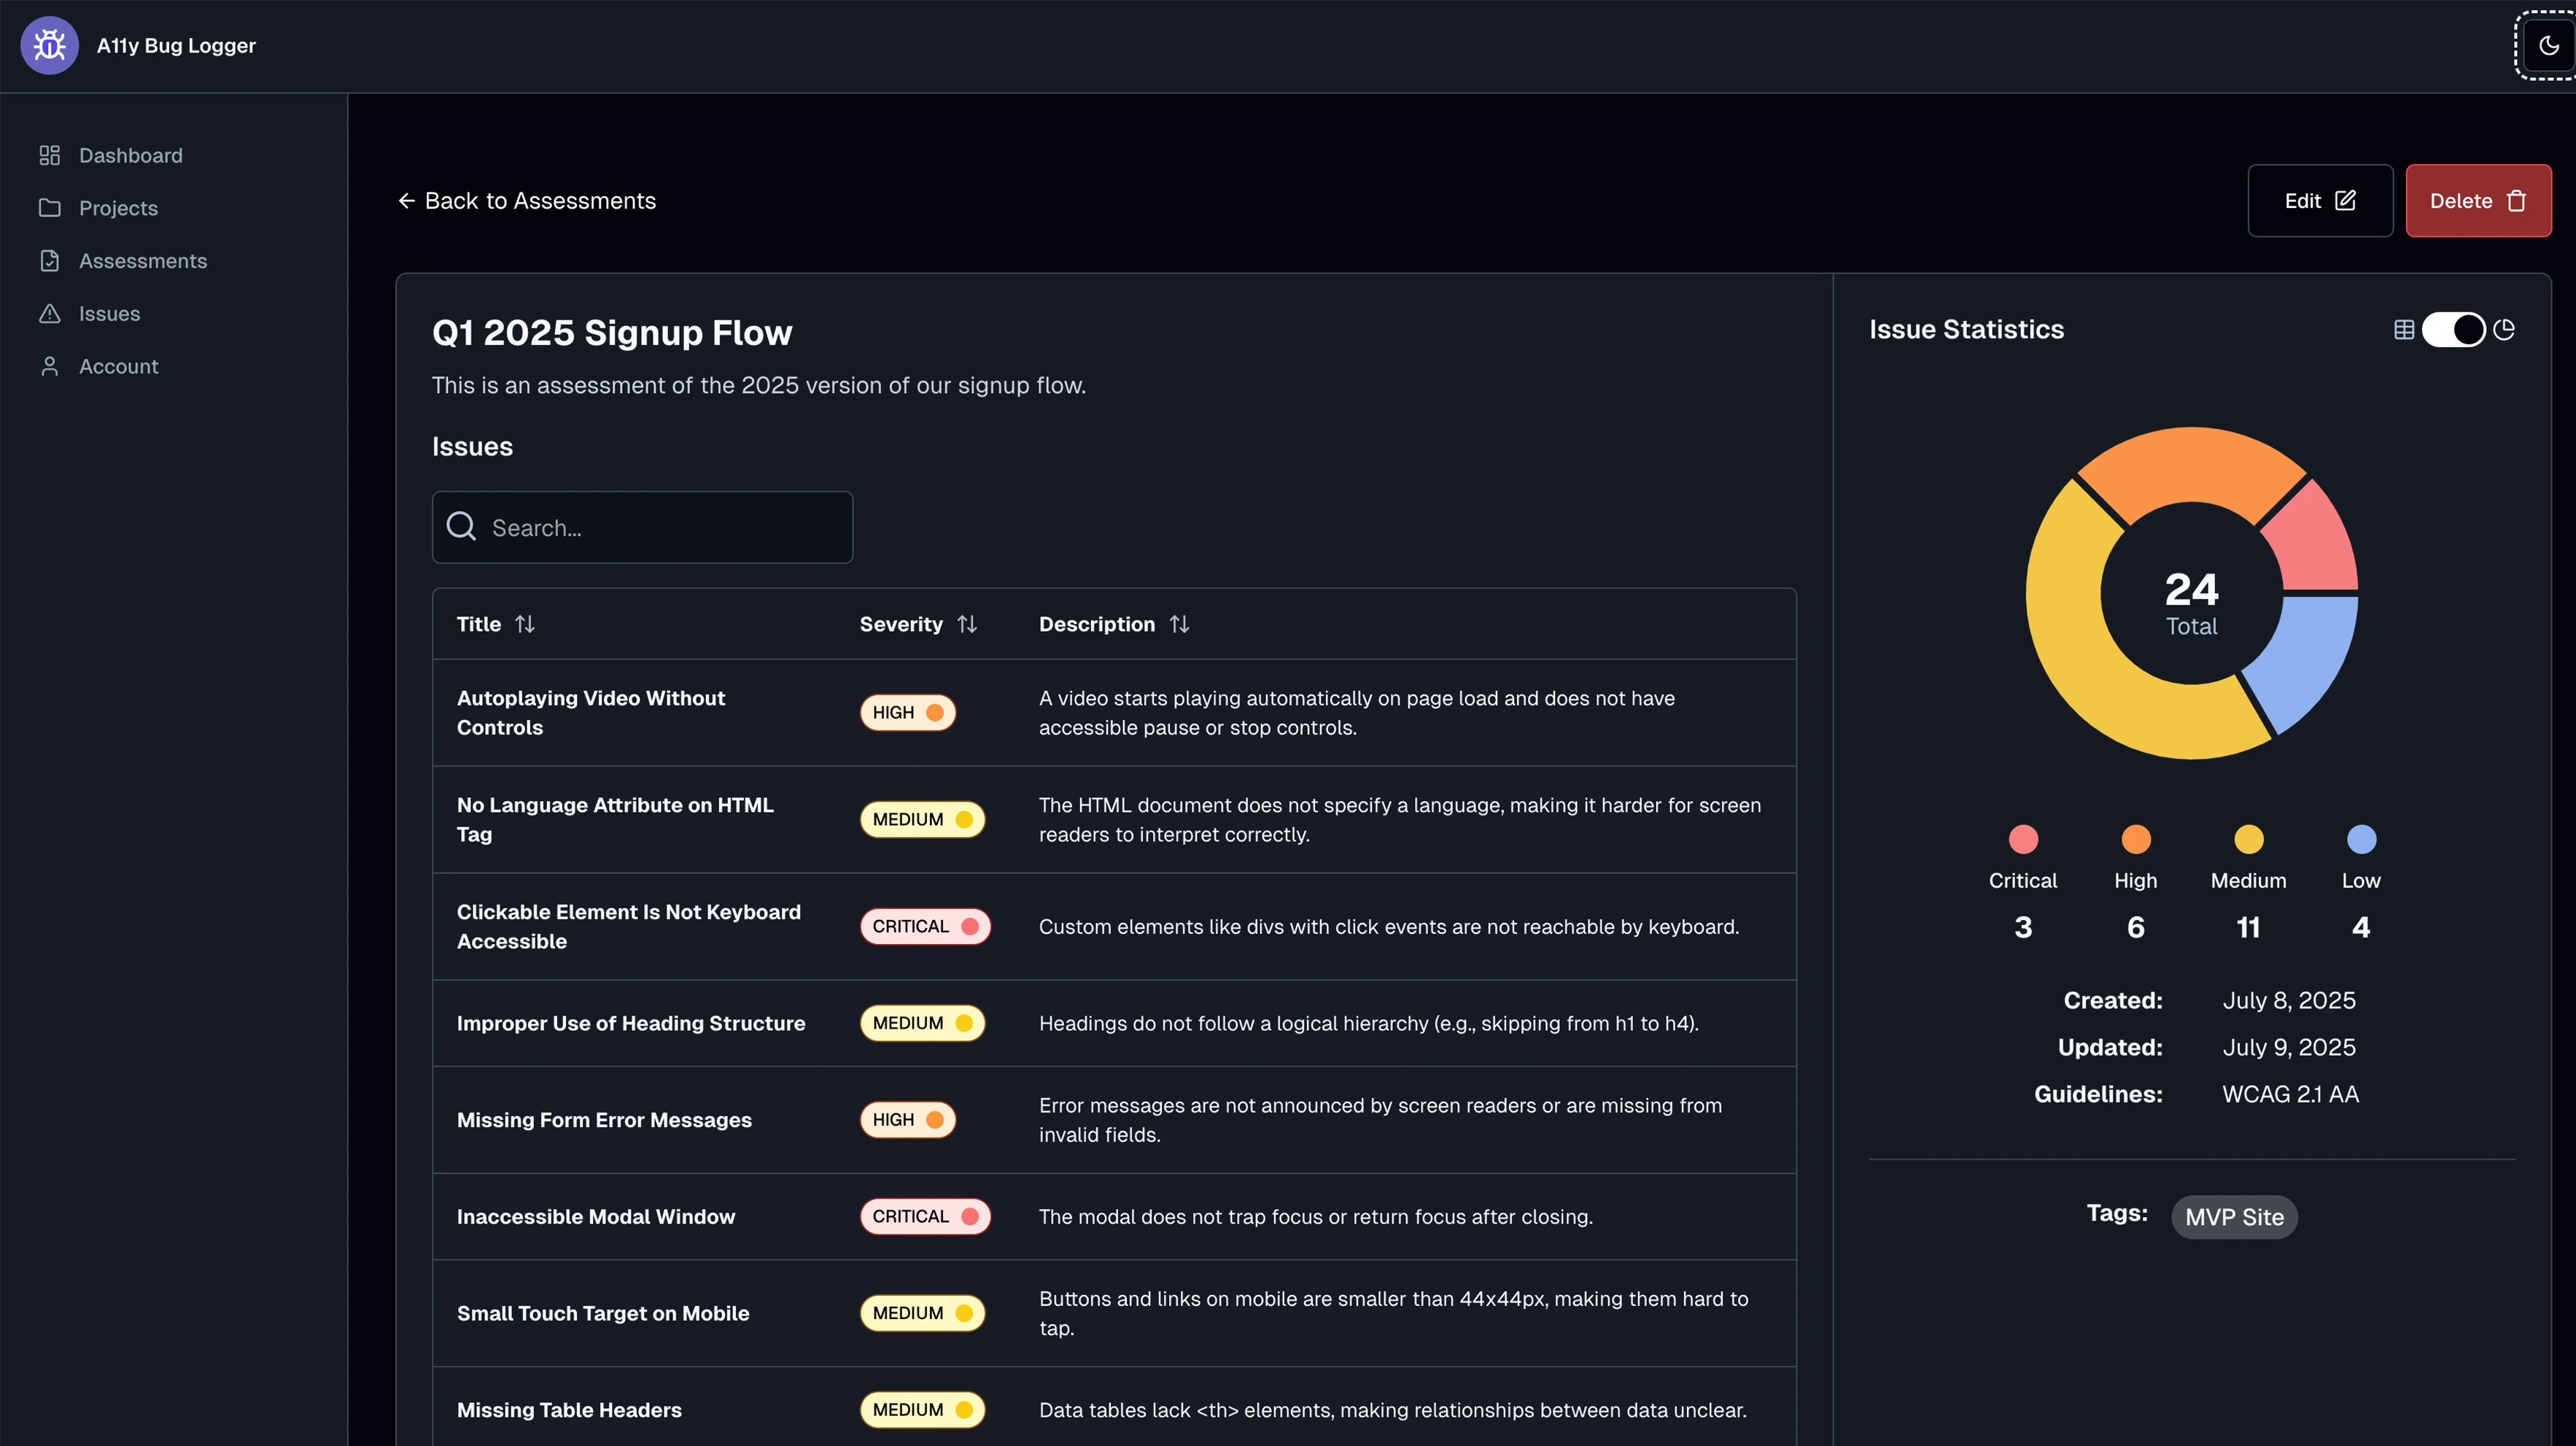
The user interface for this application was designed to be as simple and intuitive as possible. Think of it as a highly stripped-down version of JIRA that can be used effortlessly by both technical and non-technical users to log accessibility issues.
Wireframe #1: Issue List
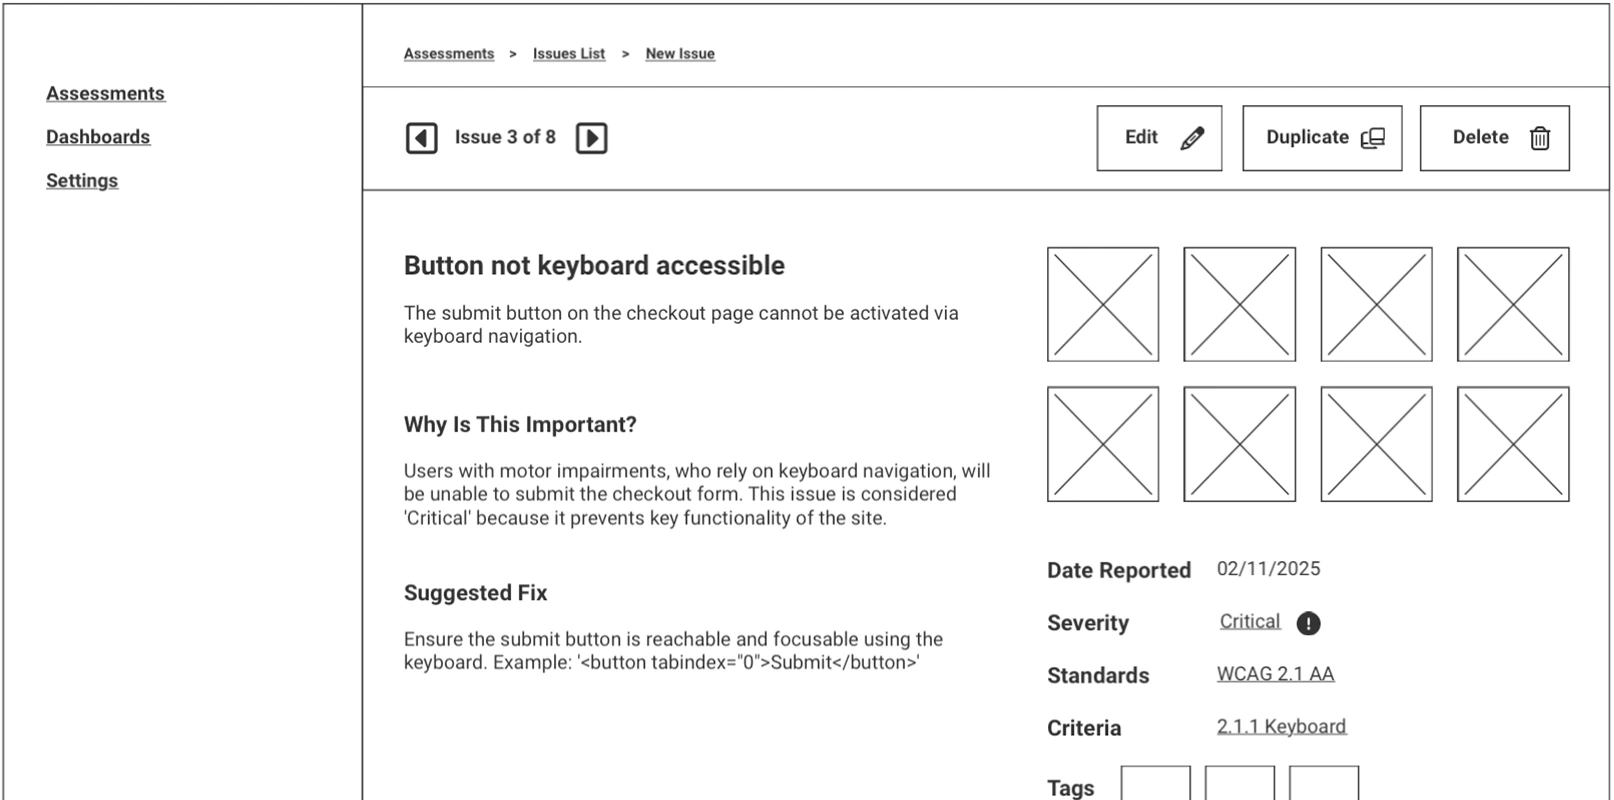
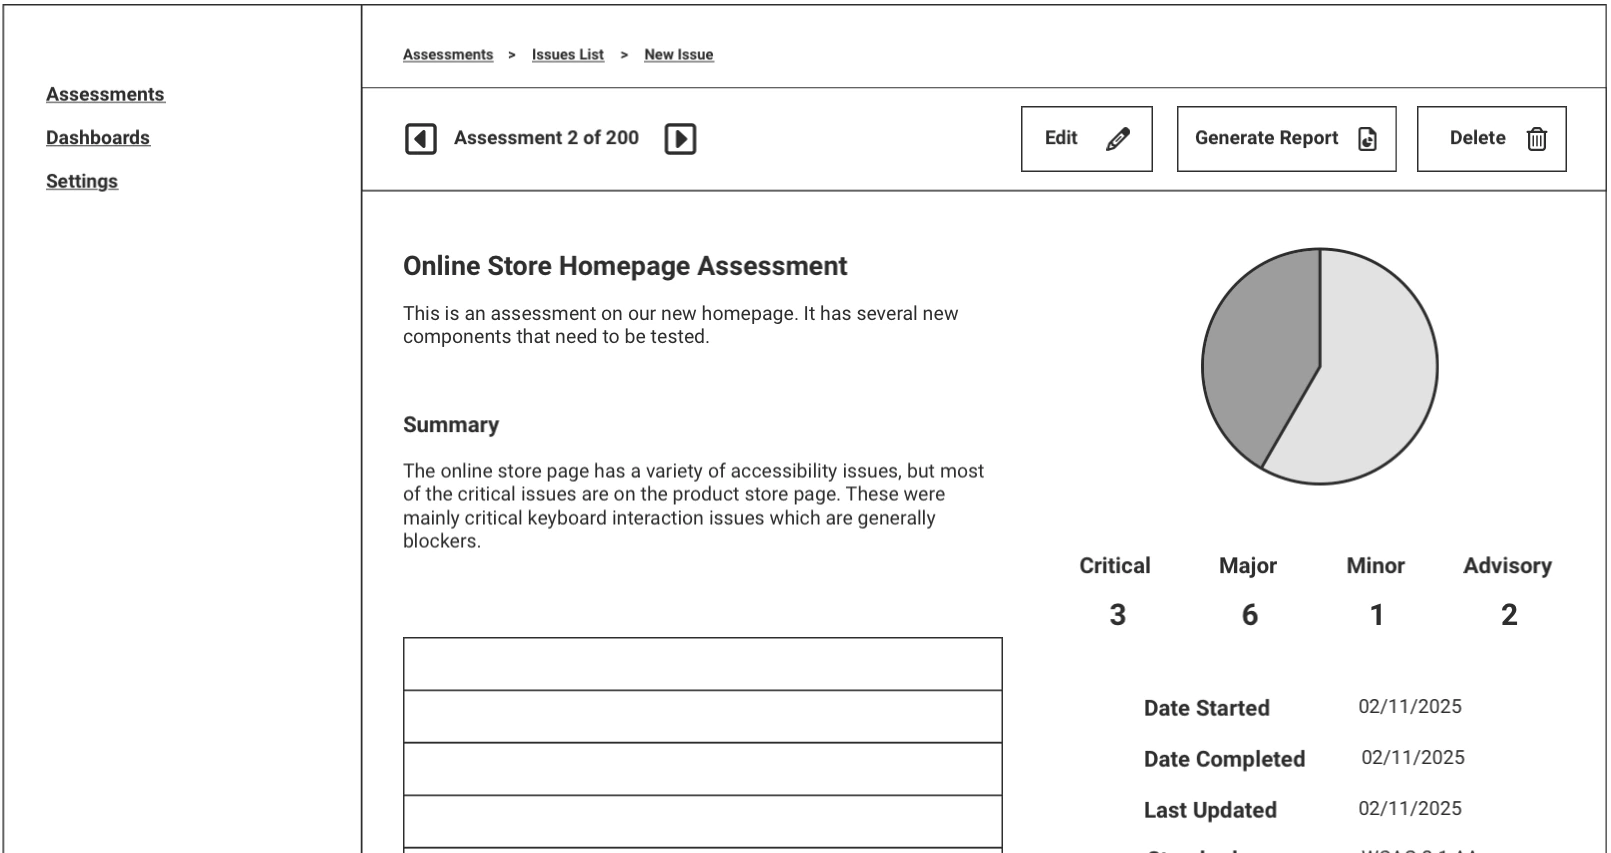
During the high-fidelity design phase, accessibility of the UI itself was a top priority. Large, bold fonts, clear focus and hover states, and high-contrast color palettes were employed to ensure usability for individuals with visual impairments.
Keyboard navigation was also a key focus. Logging issues can be tedious, so every possible comfort and efficiency improvement was considered to make the experience more fluid and accessible.
Technical:
The current stack is unified around Next.js (App Router) with Tailwind CSS, Supabase (PostgreSQL) for data and auth, OpenAI SDK for AI enrichment, and Cloudinary for image storage.
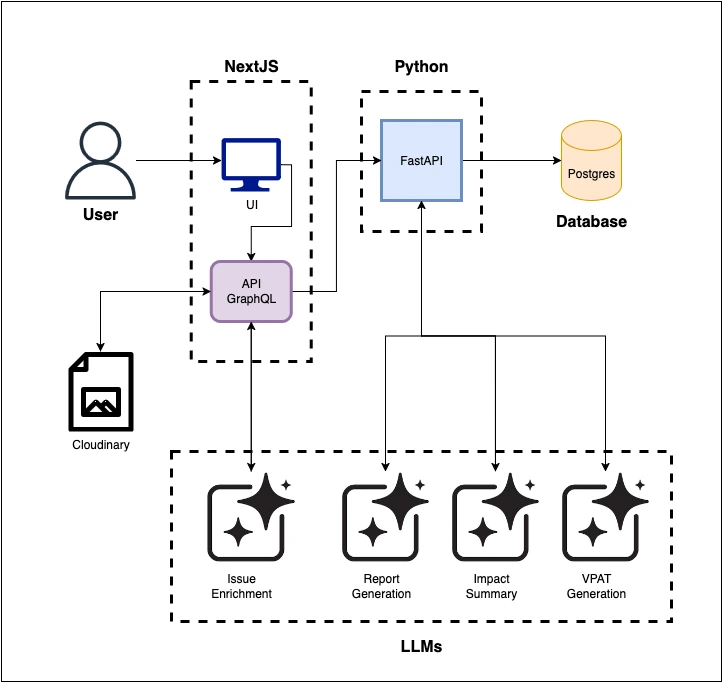
AI features now run through server-side Next.js API routes:
POST /api/reports/[assessmentId] builds an assessment JSON, calls the model using a master or persona mode, validates strict JSON, and returns a structured report. A GET /api/reports/[assessmentId] endpoint returns the latest saved report when persistence is enabled. Issue images are uploaded to Cloudinary, and URLs are stored in the database via Supabase.
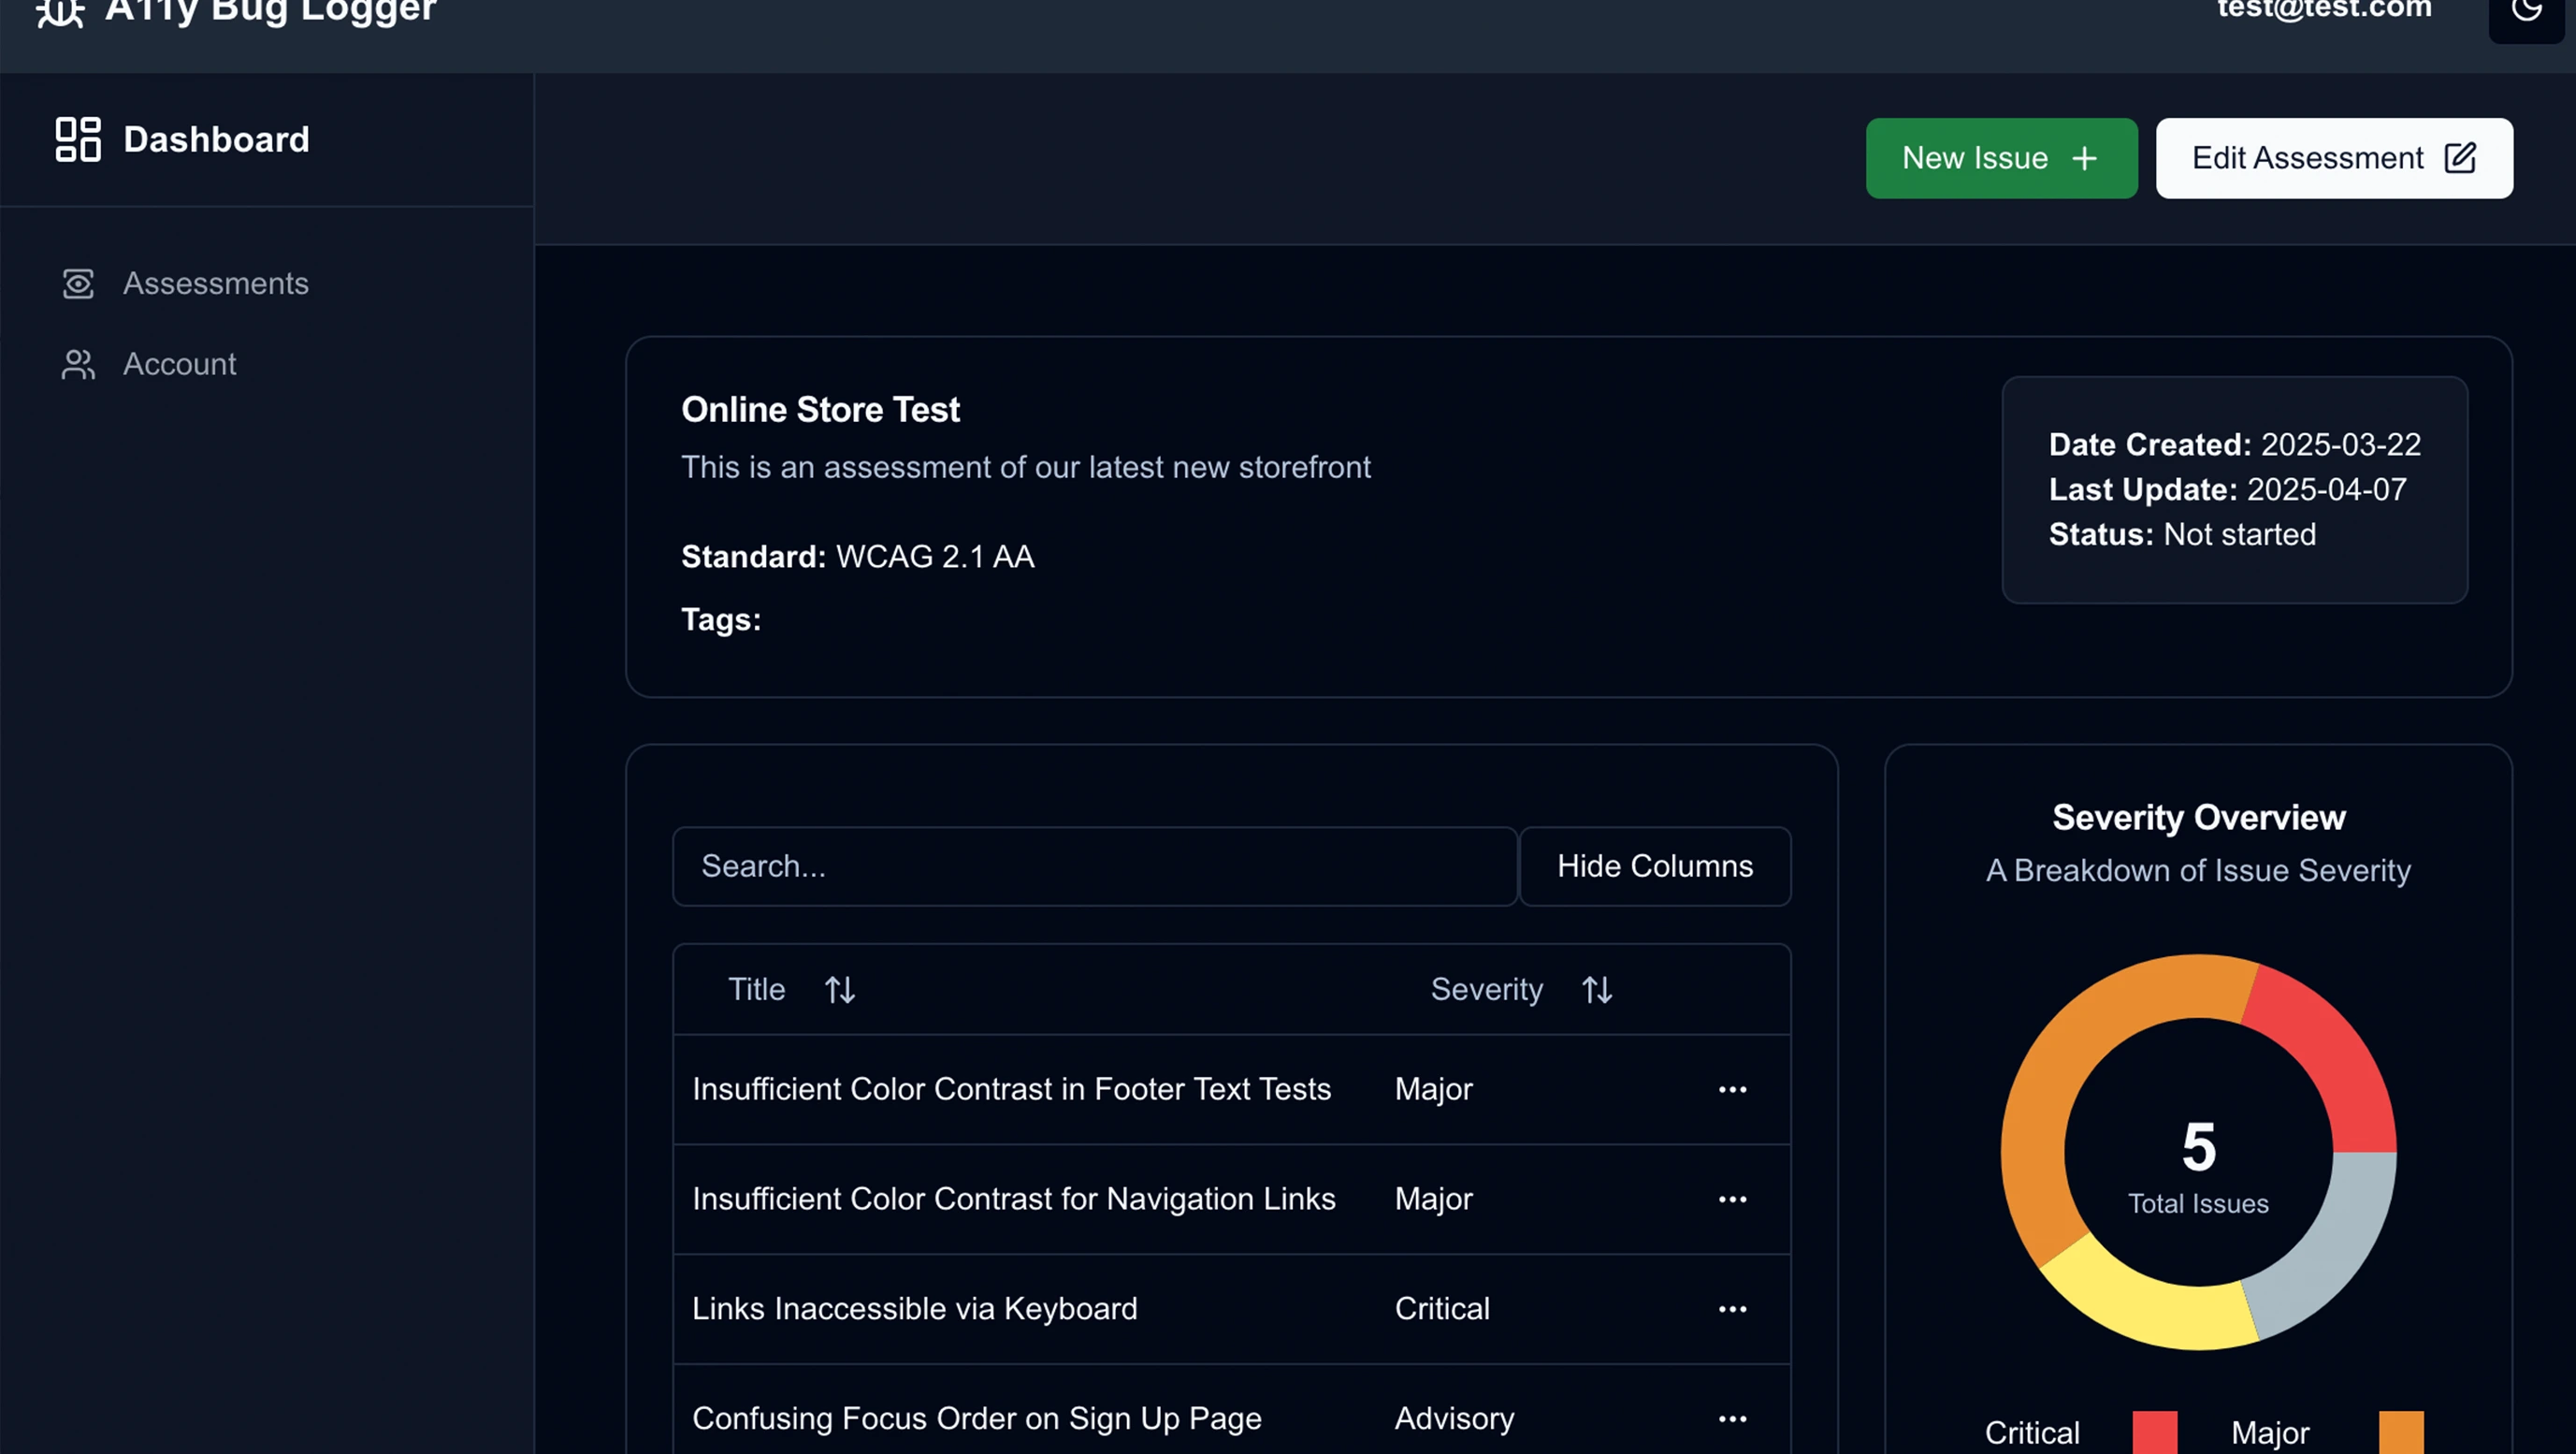
In the UI, the Assessment Details page includes a "Generate Report" button. On success, users are taken to a Report Details dashboard that renders the executive summary, persona summaries, and WCAG breakdown alongside issue statistics.
Conclusion:
The core functionality is live: users can log issues with AI enrichment, generate an assessment report with one click, and view summaries and charts in the Report Details dashboard. Persistence for reports and PDF export are on the roadmap. The next focus is refining the prompt quality, enabling persona-only regeneration, and continuing user testing to keep the end-to-end flow fast, accurate, and inclusive.